Project Description
![]()
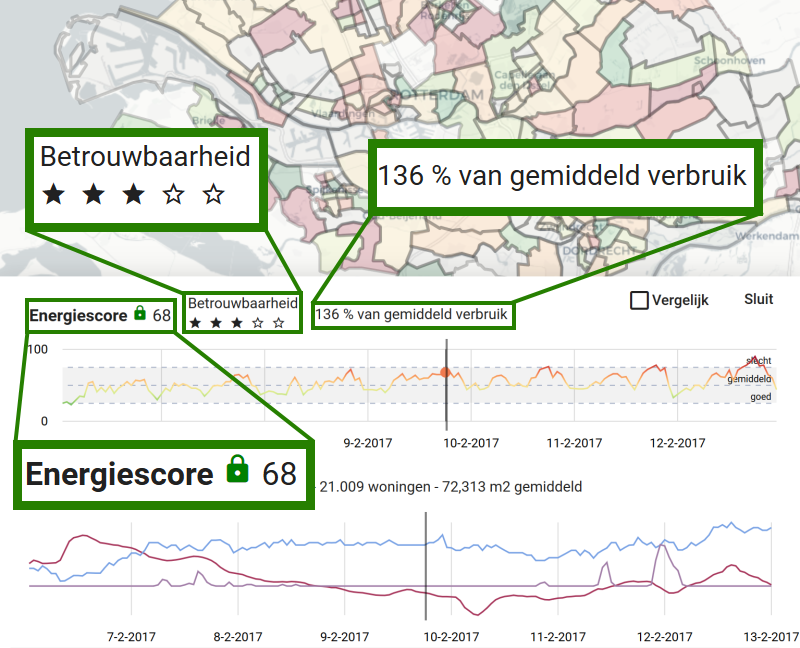
We have created an Interactive Energy Map of the Netherlands for Intergas Heating NL which visualizes how households compare to one another with regards to natural gas heating performance. The map was created based on many billions of measurements spanning 5+ years of high frequency data combined with open data from NL government. Data is shown per hour per neighborhood and is normalized for environmental conditions.

